


APA 7: TWs Editor. (2023, November 17). Latest Plant Hardiness Map Revealed for Gardeners Across the United States. PerEXP Teamworks. [News Link]
The most recent map, a collaborative effort between Oregon State University’s PRISM Climate Group and the USDA’s Agricultural Research Service, is hailed by the USDA as the most precise and detailed release to date.
PRISM, an acronym for Parameter-elevation Regressions on Independent Slopes Model, is a component of the OSU College of Engineering. The earlier iteration of the plant hardiness map, also reliant on PRISM data, was introduced in January 2012. The updated plant hardiness map, in contrast, integrates information from 13,412 weather stations, marking a substantial increase from the 7,983 stations employed in the 2012 edition.
Available in an interactive format within a Geographic Information System, the map relies on 30-year averages (1991 to 2020) to represent the lowest annual winter temperatures at designated locations. In contrast, the 2012 edition utilized averages spanning from 1976 to 2005.
The winter’s low temperatures play a pivotal role in determining the survival of plants in particular regions. PRISM recently unveiled the most recent edition of its flagship product, the 30-year climate normals, in December 2021. These climate normals, updated every decade, involve the removal of data from the previous decade and the incorporation of data from the most recent period.
Christopher Daly, the director of the PRISM Climate Group and lead author of the map, explained that the enhanced accuracy and detail in the updated Plant Hardiness Zone Map are a result of incorporating numerous new weather stations and employing advanced mapping techniques using the latest PRISM technology. However, he also noted that some localized changes in the map are not climate-related, emphasizing that they are outcomes of the improved data and mapping methods rather than actual climate variations.
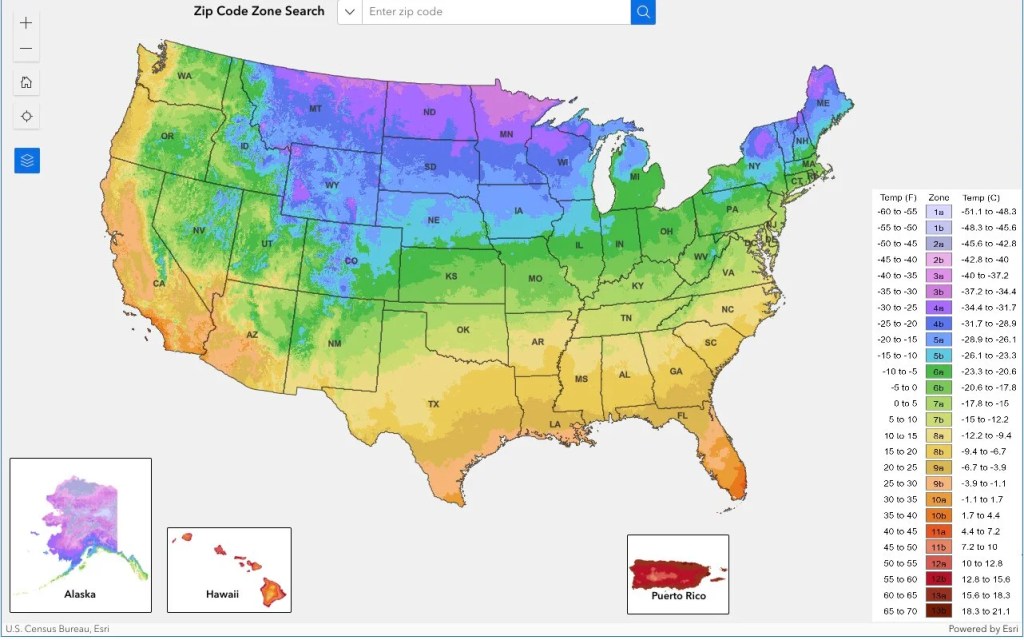
The plant hardiness map comprises 13 zones, each delineating a temperature range of 10 degrees Fahrenheit. Furthermore, each of these zones is subdivided into two half zones, each representing a 5-degree temperature range.
According to Christopher Daly, the director of the PRISM Climate Group, the 2023 map is approximately 2.5 degrees Fahrenheit warmer than its 2012 counterpart across the contiguous United States. This temperature difference resulted in approximately half of the country moving to a warmer 5-degree half zone, while the other half remained in the same half zone. Specifically, the central plains and Midwest experienced the most significant warming, while the southwestern U.S. showed comparatively minor temperature changes.
The new map comes with a “Tips for Growers” feature, offering insights into Agricultural Research Service programs that are likely to be valuable for individuals engaged in gardening, plant cultivation, and breeding.
The USDA identifies the approximately 80 million American gardeners and growers as the primary users of the map. Additionally, the USDA Risk Management Agency relies on the map to establish specific crop insurance standards. Furthermore, scientists incorporate the plant hardiness zones into research models, including those focused on studying the proliferation of exotic weeds and insects.
Resources
- NEWSPAPER Lundeberg, S. & Oregon State University. (2023, November 15). New plant hardiness map, used by gardeners nationwide, is unveiled. Phys.org. [Phys.org]


