





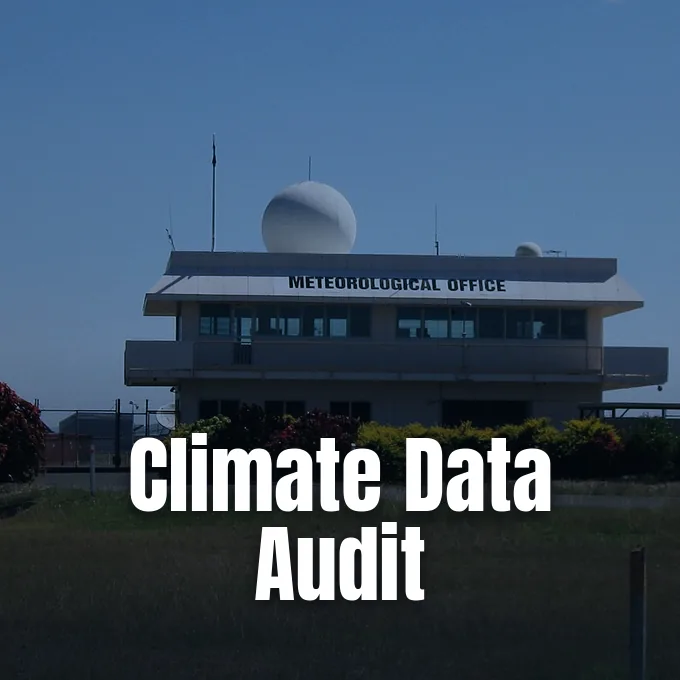
The Australian Bureau of Meteorology has defended Australian temperature records after an audit published by The Australian newspaper alleged data handling errors. The audit claimed to identify duplicated monthly records and improbable temperature runs at regional weather stations. In response, a bureau spokesperson said that the flagged duplicate entries represent fewer than 200 daily observations out of more than seven million readings, with no meaningful effect on climate trends [1].
Origins of the Forensic Audit
The public dispute began when The Australian published a series of articles detailing an investigation conducted by Tom Berger and Geoff Sherrington. Berger worked as a corporate entertainer specialising in deception analysis. He collaborated with Sherrington, a retired mining geochemist who signed a declaration in 2022 rejecting the climatic role of carbon dioxide, to examine online archives. Their investigation used statistical software to detect potential irregularities in online archives, although the published report did not provide a detailed scientific methodology [1]. Independent Tasmanian MP Andrew Wilkie forwarded the document to the Bureau of Meteorology on behalf of Berger, which prompted agency analysts to examine the disputed figures. Bureau chief executive Stuart Minchin welcomed the public scrutiny [2].
The Australian environment editor Graham Lloyd wrote that the audit revealed serious questions about data integrity. The newspaper published at least eight separate coverage pieces, including news stories, cartoons, and an editorial by climate sceptic David Evans demanding an end to alleged secret practices. Former prime minister Tony Abbott called for an independent inquiry into the findings, while broadcasters News24, Sky News Australia, and 2GB amplified the claims. Wilkie had received no interview request from the newspaper before publication. He described the coverage as “quite feverish, and red meat to its audience,” reiterating his confidence in the Bureau of Meteorology [1].

Why Australian Temperature Records Contained Duplicate Months
The audit identified duplicate entries at Sydney Observatory Hill. Online minimum temperature records for August 1867 matched August 1907 for all 31 days [1]. Researcher Jennifer Marohasy said that checking original Daily Meteorological Observations at the National Archives confirmed that the online 1867 entries were incorrect [2]. When evaluating Australian temperature records, Bureau of Meteorology scientists verified that ten separate months contained duplicated minimum temperatures at Sydney Observatory Hill, but only three occurrences took place after 1910, with a fourth month detected at Charleville in Queensland [1, 3]. Affected values totaled fewer than 200 daily readings out of seven million observations. All four post-1910 instances came from pre-1946 handwritten observation sheets digitised decades ago [3].
Pre-1910 observations are excluded from official climate datasets. Because ACORN-SAT begins in 1910, a bureau spokesperson said the 1867 duplication has zero mathematical relevance to national warming calculations [1]. Corrections took effect on 19 October 2026. Bureau investigations across Queensland and Victoria detected no additional duplicated months, confirming that isolated transcription errors had a negligible impact on long-term continental trends [1, 3].
Disputed Patterns Across Weather Stations
Beyond duplicated monthly blocks, the audit argued that unusual temperature runs pointed to “obvious patterns of human intervention” in official archives. The report focused on Palmerville on Queensland’s Cape York, where weather stations recorded 17 consecutive days of 31C maximum temperatures in 2004. The audit authors described this sequence as a “data failure” and argued that the chance of it occurring naturally was “less likely than winning the lottery every week for a year” [1]. Geoff Sherrington reported that similar anomalies appeared at weather stations in the Northern Territory, Western Australia, southern Victoria, and Macquarie Island. In an analysis of the 50 largest duplicate blocks in 17 stations, Berger and Sherrington claimed that 31 involved copying from one calendar month into another. Some observation gaps lasted 647 days at an ACORN-standard station [2].
The Bureau of Meteorology dismissed allegations of data manipulation, explaining that the audit misunderstood tropical meteorology and early recording methods [3]. Raw observations at Palmerville were recorded to the nearest whole degree instead of tenths of a degree, which makes repeated integer values common in tropical climates [1]. In tropical zones, lower temperature variability naturally produces matching maximum readings over consecutive days [3]. Stuart Minchin rejected claims of fraud. Over 40 percent of the anomalies identified by Berger and Sherrington occurred after 1990, but the bureau confirmed that raw station records undergo continuous quality assurance [2, 3].



Digitisation Errors from Punch Card Archives
To account for duplicated records, Bureau of Meteorology climatologists investigated early data transfer workflows [1]. Weather observations in Australia started soon after the First Fleet landed, but standardized continental tracking began in 1910 when the national bureau formed. Observers originally recorded daily temperatures by hand in paper field books [3]. Agency specialists developed a working hypothesis that duplications entered the archives during the 1950s or 1960s, when staff transcribed handwritten logs onto early punch card systems. Discussions with retired bureau employees indicated that manual digitisation occurred before the 1980s, creating opportunities for human transcription errors during card processing [1]. Punch card systems served as standard tools for sorting tabular weather observations before magnetic tape storage arrived [3].
Tom Berger disputed the punch card explanation. He argued that the bureau had “acknowledged a few trees but denied the existence of the forest” by treating database-level duplications as simple processing mistakes. Software updates should have caught the errors [2]. The Bureau of Meteorology countered that digitising millions of paper records was a demanding manual task that produced occasional transcription mistakes without altering overall warming trajectories [3].
How Australian Temperature Records Passed Peer Reviews
To measure climate trends without distortions from local environmental changes, the bureau created the ACORN-SAT network [1]. The dataset tracks observations from 112 weather stations selected to maximize continental coverage and record longevity, where scientists apply homogenization methods to adjust for station relocations or equipment changes over time. Independent peer reviews evaluated Australian temperature records and homogenization methods in 2011, 2015, and 2017. These scientific review panels expressed strong confidence in the bureau’s homogenization techniques and rated its practices among the best in the world [3]. Geoff Sherrington observed that maximum-temperature adjustments at Sydney Observatory Hill were positive in every year from 1910 to 2020, but the bureau confirmed that all homogenization methods are published in peer-reviewed scientific journals [1, 2].
Addressing accusations of “secret climate business” raised in commentary by David Evans, the bureau clarified that original measurements are never overwritten or deleted [1]. Raw field observations stay permanently archived in their original form, while quality adjustments are recorded in separate datasets. Both unadjusted raw numbers and processed ACORN-SAT datasets are publicly available online for independent examination [3]. Long-term measurements show that temperatures in Australia have risen by more than 1.5C since 1910, consistent with findings from international monitoring networks [1].
Scrutiny and Climate Data Integrity
Public disputes over weather archives reflect a recurring pattern, with climate sceptics targeting Bureau of Meteorology records for more than 15 years. Previous episodes were characterized by scientists as harassment that consumed valuable institutional time, while one former bureau boss described the source of earlier attacks as a “fever swamp” of climate science denial. Guardian Australia correspondent Graham Readfearn observed that sceptics routinely bring claims to The Australian rather than publishing in scientific literature. Transparent verification helps the public connect meteorological records with long-term emissions policies, including national initiatives designed to achieve Australia climate targets. Validated observation series ensure that policy decisions rely on sound empirical evidence [1].
Robust temperature datasets also allow climatologists to investigate how changing seasonality and extreme heat influence weather patterns throughout diverse regional ecosystems. While acknowledging the need to correct historical transcription errors in digitised archives, the bureau stated that it maintains zero tolerance for individual staff members being singled out in public debate. Scientific literature and formal peer review remain the primary channels for evaluating meteorological data, allowing Australian climate records to withstand sustained public scrutiny [3].
- ONLINE NEWS Readfearn, G. (2026, October 24). The BoM’s temperature record keeping is under attack – again. What’s going on? | Temperature Check. The Guardian. [Article Link]
- WEBSITE Wayne, J. (2026, October 21). BOM Bombs Audit on Shonky Temperature Data. blog.alor.org. [Article Link]
- PRESS RELEASE Bureau of Meteorology. (2026, October 22). Science Behind Australia’s Long-Term Temperature Record. Mirage News. [Article Link]
Cover image: RegionalQueenslander / Wikimedia Commons, CC BY-SA 4.0
APA 7: PerEXP Teamworks. (2026, October 25). Bureau of Meteorology Defends Australian Temperature Records. PerEXP Teamworks. https://perexpteamworks.com/en/australian-temperature-records-data-audit/


