



For over a century of Australian football tradition, AFL grand finals have carried the reputation of being the most physically demanding matches of the sporting calendar. Commentators and supporters regularly describe the September decider as an unmatched crucible of body-to-body collisions, relentless running, and unforgiving pressure. Yet an extensive historical examination across 5,111 matches demonstrates that this long-held assumption fails to reflect actual competition metrics [1].
Qualifying Matches Exceed AFL Grand Finals in Physical Strain
To evaluate match toughness across modern football, sports scientists Joel Garrett from Griffith University and Hunter Bennett from Adelaide University analyzed league records spanning from 2000 through 2025. Their findings show that finals football systematically alters how teams handle possession compared to the home-and-away schedule. Total disposals fall from 361.5 in regular games to 347.5 in finals, an outcome driven almost entirely by handballs declining from 152.5 to 140.6 while kicks remain nearly constant. Uncontested possessions fall from 220.3 to 203.2, whereas contested possession rates rise from 38.6% to 41.1%. Disposal efficiency slips from 72.4% to 70.8%, confirming that finals reduce open space and force congested contests [1].
Despite the ferocious atmosphere surrounding the championship game, AFL grand finals do not record the highest physical contact of the post-season. Since 2012, qualifying finals have consistently surpassed deciders across primary contact measures. Qualifying matches average 138.6 tackles and 291.4 contested possessions, yielding a 43.0% contested possession rate. Grand finals during that identical period produced 135.5 tackles and 279.1 contested possessions, proving that the season decider does not subject players to the highest contest concentration. Qualifying finals also finish as the lowest-scoring fixtures each September, averaging just 152.6 combined points [1].
When ranking all nine post-season games by tackle volume, the decider typically sits around fifth. In the past fourteen seasons, it has never led the league in contested possessions. Both Garrett and Bennett published these findings as a preprint that has not undergone formal peer review [3].

GPS Tracking Highlights Sprinting Workload and Energy Demands
Physiological tracking conducted by sports scientist Rob Aughey provides clear evidence that physical exertion intensifies dramatically during the post-season. In his research on eight elite athletes from an Australian club during the 2008 season, wearable global positioning sensors recorded substantial increases in movement volume compared to regular season contests against identical opponents. Athletes accumulated 11% more total distance during finals, with peak elevations emerging during rotations in the second half. Running at maximal acceleration (the fastest speed at which an athlete accelerates) covered an extra 450 metres per player, which demanded 410 additional kilojoules of energy from acceleration alone. Players also registered 9% more high-intensity running, totaling roughly 3,500 metres per athlete [2].
Accelerations added 450 metres [2]. Additional metabolic output reached 410 kilojoules.
Intriguingly, subjective exhaustion did not increase despite these running demands. When Aughey evaluated player feedback using a standardized rating of perceived exertion, athletes reported similar fatigue levels across regular season and finals fixtures. This stability indicates that structured training regimes successfully conditioned players for the postseason jump in aerobic intensity. Aughey noted that “the opposing team affects the tempo of the game more than the type of game played.” Like the Adelaide and Griffith dataset, Aughey’s analysis circulated as a preprint without formal peer review. Broader trends in digital engagement and audience fatigue parallel patterns seen in analyses of cancelling Xbox Game Pass [2].
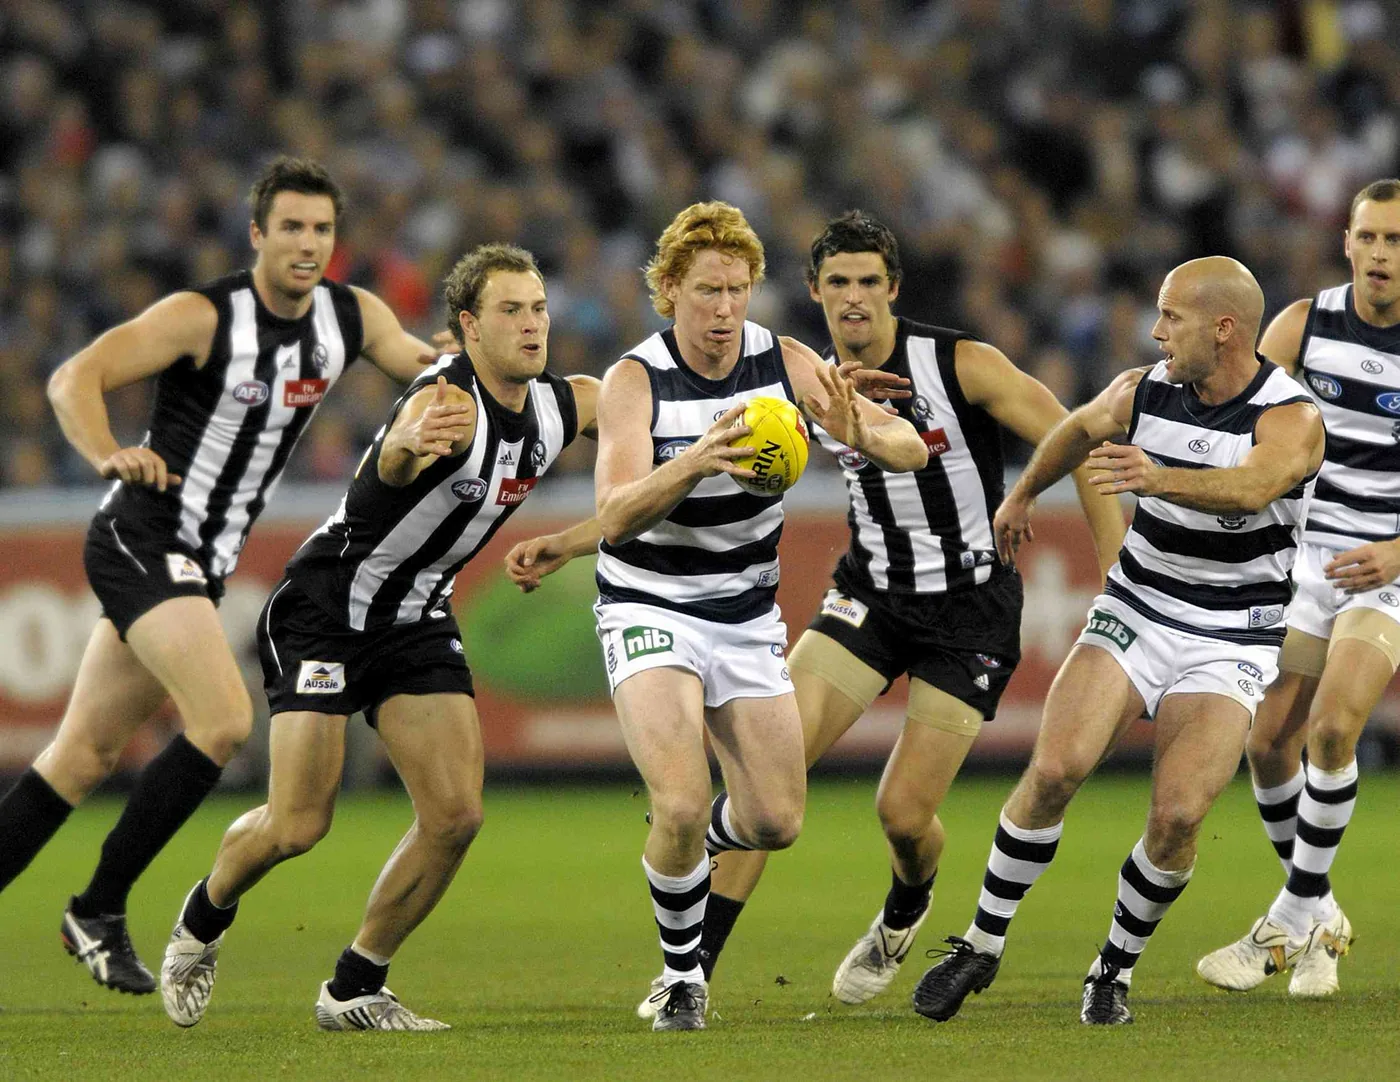
Fourth Quarter Scoring Collapses Create Decisive Margins
While AFL grand finals hold unmatched theatrical stakes, they frequently conclude in lopsided scorelines. The average grand final winning margin reaches 38.4 points, making the decider more uneven than any other round of home-and-away or finals football. One-third of all grand finals finish with margins of 50 points or more, contrasting sharply with 23.1% in other finals rounds and 24.8% during regular home-and-away competition [1]. Match data compiled by Bennett and Garrett demonstrates that this divergence occurs almost entirely during the closing stages.
Through three quarters of play, deciders remain remarkably balanced. The margin at three-quarter time sits at 26.9 points, narrower than the regular season average of 27.7 points. However, the score differential swells by an average of 11.4 points during the final quarter alone, compared to a modest 4.5-point expansion across other finals series matches. Teams leading at the final break convert that advantage into victory 92.6% of the time [1].
Fixture scheduling also shapes competitive wear leading up to September. Reporting by Jon Pierik in The Age utilizing Champion Data showed how uneven fixture difficulty impacts late-season stamina. In 2025 assessments, Port Adelaide faced the competition’s most grueling fixture with a difficulty rating of 1, whereas Geelong enjoyed the easiest run home at 18. Such scheduling disparities influence whether squads enter finals battle-hardened or depleted. Strategic coordination across high-stakes team environments also mirrors competitive dynamics described in the Marvel Tokon Fighting Souls review [6].


Why Is the AFL Grand Final a Public Holiday?
Victoria observes the Friday before the AFL Grand Final as an official gazetted public holiday to celebrate the sport’s cultural prominence and facilitate massive attendance at the Grand Final Parade. Instituted in 2015, the holiday transforms downtown Melbourne into a shared civic celebration where tens of thousands of supporters line central streets to cheer advancing players. Local businesses frequently close early or cease operations entirely, acknowledging that economic life in the city pauses during decider weekend. Fans routinely camp overnight outside the Melbourne Cricket Ground (MCG) to secure general admission seating, demonstrating an enthusiasm that extends far beyond ordinary sporting loyalty [7].
Public festivities surrounding the match have evolved across decades of broadcast growth. While delayed television broadcasts commenced in 1961, live national broadcasts now capture audiences of millions across Australia. Aside from 2020 at the Gabba in Brisbane and 2021 at Optus Stadium in Perth due to pandemic restrictions, Melbourne has remained the permanent geographic epicenter of decider celebrations. The festive atmosphere contrasts sharply with earlier eras, where crowds spilled over boundary fences and sat directly against the turf during record-breaking encounters [4].
How Long Is an AFL Grand Final?
An AFL Grand Final lasts approximately 120 to 130 minutes of running game time across four 20-minute quarters, extended beyond standard timing by umpire whistles for stoppages, out-of-bounds balls, and goal celebrations. When pre-match entertainment, team entrances, half-time ceremonies, and post-match Norm Smith Medal presentations are included, the television broadcast regularly spans more than three and a half hours. The extended duration creates unique physical challenges, as players must maintain strategic discipline while confronting progressive physical fatigue under constant defensive pressure [7].
This prolonged playing time amplifies subtle tactical shifts in how teams move the football. Uncontested marks drop from 78.9 to 72.7 per match, while contested marks climb from 10.6 to 11.5 as defending players fiercely contest territory across every sector of the ground. Players must repeatedly dispute aerial balls in crowded packs rather than receiving uncontested passes on the wing. Handball volume fell to 140.6 [1]. Kicks barely shift, hovering around 207 per side throughout modern deciders.
Tackling volume over the full four quarters has also shifted across different eras of Australian football. Tackling counts during AFL grand finals rose from an average of 96.8 between 2000 and 2005 to 149.5 between 2006 and 2010. That intensity remained steady through 2016-2020 at 148.0 tackles before dropping steeply to 118.8 in the five years leading into 2026. Bennett and Garrett emphasize that counting statistics provide valuable insight into tactical evolutions across 26 seasons [1].
How Many AFL Grand Finals Have There Been?
By the conclusion of the 2025 season, the Victorian Football League and Australian Football League have staged a total of 130 grand finals since the inaugural decider in 1898, a tally that includes three full match replays following drawn contests. The very first grand final took place on September 24, 1898, at the St Kilda Cricket Ground, where Fitzroy defeated Essendon by a scoreline of 5.8 (38) to 3.5 (23) in front of 16,538 spectators. In 1902, the championship clash moved to the Melbourne Cricket Ground, where Collingwood defeated Essendon before 35,000 supporters. Attendance expanded rapidly in subsequent decades, reaching a historic peak of 121,696 spectators during the 1970 Carlton and Collingwood decider. Fitzroy won the inaugural match [4].
Club dominance has defined specific chapters of league history. Carlton and Collingwood share the historical record with 16 premierships won in grand finals, while Essendon has captured 16 total premierships, including 14 earned through deciders. Collingwood has contested 45 grand finals, more than any rival club, and established an enduring record by winning four consecutive premierships between 1927 and 1930. Hawthorn legend Michael Tuck holds the individual record for decider appearances, participating in 11 grand finals during his career. Michael Tuck contested 11 deciders [7].
Competitive balance changed permanently following the introduction of equalisation policies, specifically the national draft and salary cap in 1987. Between 1967 and 1989, only five clubs captured a premiership flag. Since 1990, 14 different clubs have achieved premiership triumph. Modern grand finals have produced historic blowouts, such as Geelong’s 119-point victory over Port Adelaide in 2007, as well as prolonged droughts. Geelong won by 119 points [7]. South Melbourne and Sydney endured a 72-season drought between 1933 and 2005. Deciders represent the historical peak of AFL grand finals, even when qualifying clashes demand greater physical attrition [5].
- PREPRINT Garrett, J., & Bennett, H. (2026). Are AFL grand finals really the hardest game of the year? We checked the data. The Conversation. [Article Link]
- PREPRINT Aughey, R. (2011). AFL Grand Final makes players harder, better, faster, stronger … but how? The Conversation. [Article Link]
- ONLINE NEWS Garrett, J., & Bennett, H. (2026). Are AFL grand finals really the hardest game of the year? We checked the data. Yahoo News Australia. [Article Link]
- WEBSITE Wikimedia Foundation. (2025). AFL Grand Final. Wikipedia. [Article Link]
- WEBSITE Wikimedia Foundation. (2025). VFL/AFL premiership and grand final statistics. Wikipedia. [Article Link]
- ONLINE NEWS Pierik, J. (2025). Who has the hardest? Who has the easiest? We rate your team’s run home to the finals. The Age. [Article Link]
- WEBSITE Chaparro, J. (2025). 27 Facts About AFL Grand Final. Facts.net. [Article Link]
APA 7: TWs Editor. (2026, September 25). Griffith University Analysis Questions AFL Grand Finals Strain. PerEXP Teamworks.


