



A major redistribution of equatorial ocean heat is altering weather patterns across the globe this autumn as sea temperatures rise above seasonal benchmarks. Natural climate cycles like El Niño emerge roughly every two to seven years, but continuous NASA satellite observation gives scientists a clear view of how this disturbance develops. As trade winds weaken and water warms in the eastern Pacific, NOAA calculated an 83% chance that the strongest event since 1950 is now underway [1].
- What NASA Satellite Observation Shows About Kelvin Waves?
- How Rising Sea Levels Signal Pacific Warming
- How Satellite Observations Track Ocean Color Changes
- Global Precipitation Shifts Mapped by IMERG
- Why Did Pacific Warming Trigger Atacama Desert Rains?
- How NASA Satellite Observation Informs Climate Forecasts
What NASA Satellite Observation Shows About Kelvin Waves?
Early signs of the warming pattern first appeared in satellite records in January 2026 when instruments detected a large pulse of warm water known as a Kelvin wave near Micronesia in the western Pacific. These slow-moving water pulses stretch thousands of miles across the basin and act like underwater freeways that carry heat from west to east [1].
Because warm seawater heats the air directly above the surface, rising air alters local pressure gradients and weakens the trade winds that normally blow from the Americas toward Asia. By early April 2026, those warm pulses reached the eastern Pacific and began elevating sea surface heights along the coastline. “Kelvin waves are like the heartbeat of El Niño,” said Josh Willis, project scientist for sea level missions at NASA’s Jet Propulsion Laboratory in Southern California. “And our sea level satellites let us peer into the ocean and watch every beat.” Spacecraft carrying radar altimeters survey millions of square miles of ocean daily, continuing an unbroken altimetry record that began in 1993 with the Sentinel-6 program [1].
This spaceborne record complements an ocean fleet of drifting sensors and diving buoys operated by NOAA in equatorial waters. Trade winds faltered. As eastward flow pushed warm water toward the Americas, sea surface temperatures in the eastern Pacific rose to about 3 degrees Fahrenheit (1.7 degrees Celsius) above normal seasonal levels by October, seeding rainstorms and altering weather across the globe. Through regular NASA satellite observation, oceanographers track these trade wind fluctuations and thermal shifts across the tropical Pacific [1].
How Rising Sea Levels Signal Pacific Warming
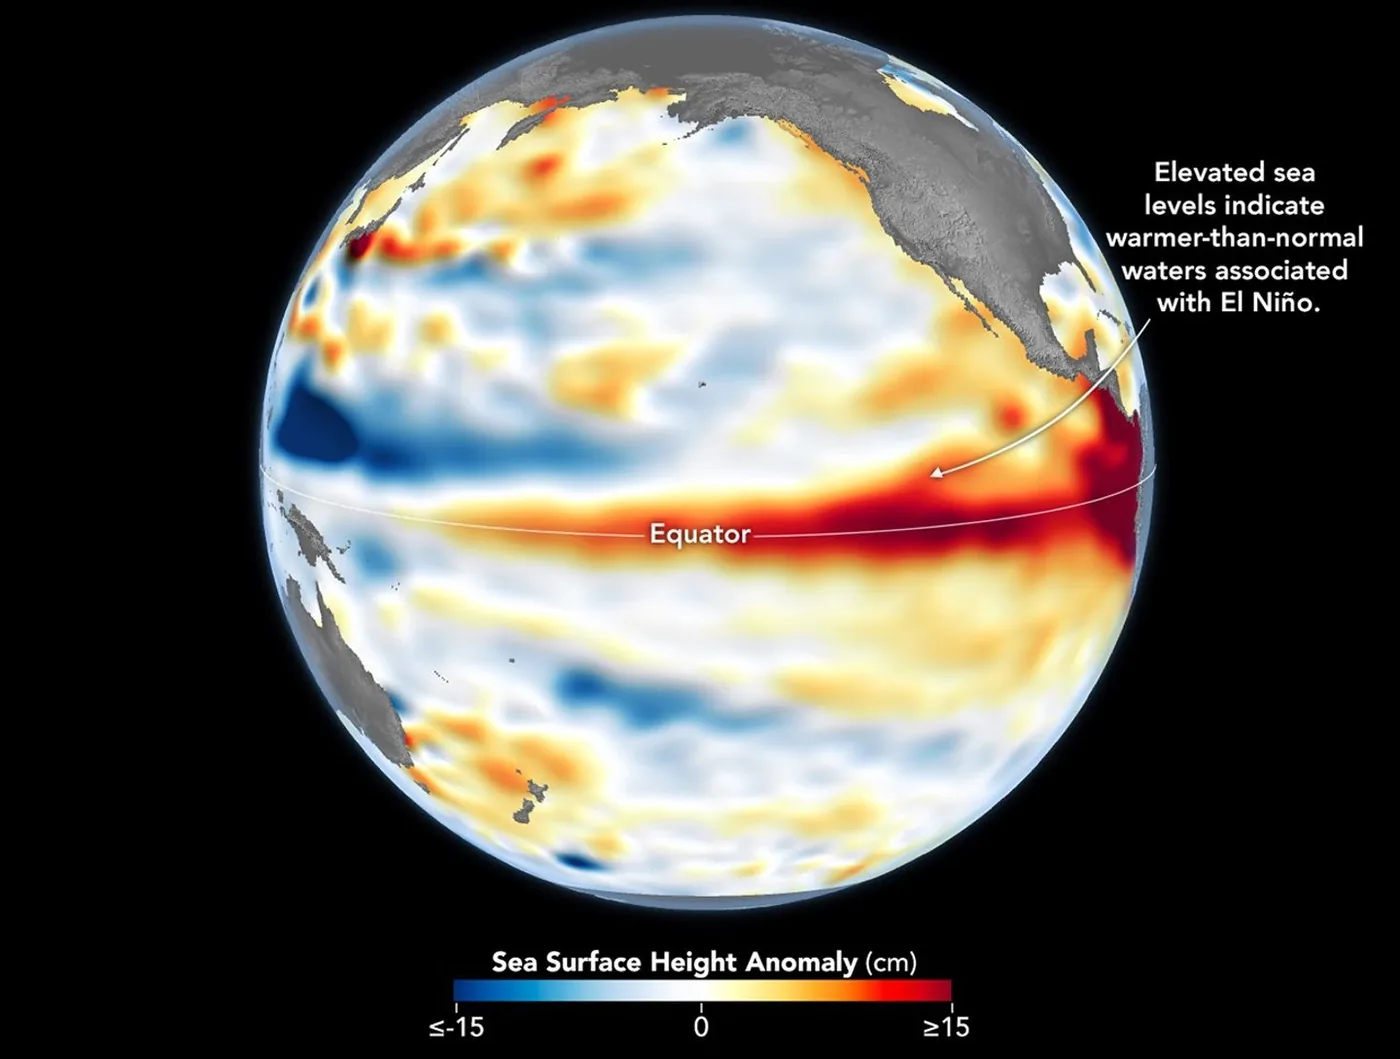
Thermal expansion plays a central role in raising sea surfaces during an El Niño event because warm water occupies more volume than cold water. In parts of the central and eastern Pacific, sea levels rose by 1 to 1.3 feet (30 to 40 centimeters) above seasonal averages [1].
Altimetry measurements from the Sentinel-6 Michael Freilich satellite, launched in 2020 through a joint effort between NASA and the European Space Agency, record sea surface height variations across all major ocean basins on a ten-day cycle with sub-inch accuracy. While infrared and microwave radiometers observe surface temperatures through clouds, altimeters reveal how much heat is stored deep in the subsurface water column. As surface flow shifts eastward, accumulating warm seawater expands the upper ocean and depresses the thermocline (the boundary layer separating warm surface water from cold deep water). This suppresses the coastal upwelling that usually keeps western South American coastal waters cool throughout the year [2].
Subsurface conditions in the western Pacific during early June 2026 closely resembled conditions observed during the opening months of 1997, a year that produced a remarkably strong El Niño. “For now, it looks like it’s going to be a big one—more so than I would have said last week—but we still need more observations to know what’s going to happen,” said Severine Fournier, deputy project scientist for Sentinel-6 Michael Freilich at JPL. Tracking these subsurface heat reservoirs helps researchers compare ongoing ocean shifts with past climate extremes, such as the investigation into the 2023 record heat wave, to determine whether deep thermal pools will sustain elevated global temperatures over multiple seasons [2].
How Satellite Observations Track Ocean Color Changes
Beyond shifting water height and temperature, equatorial Pacific waters have become measurably more blue over recent months. Areas that normally stay green from dense populations of microscopic plants called phytoplankton are losing their color as weakened trade winds shut down the upwelling of cold, nutrient-rich water from the ocean depths [1].
NASA’s PACE satellite, which launched in 2024, is providing the first hyperspectral views of an active El Niño by monitoring ocean color across several hundred wavelengths of visible, near-infrared, and ultraviolet light. “Some people think of water as being just blue, but it’s amazing the multitude of colors the ocean can be,” said Matthew Kehrli, a lead research scientist for the PACE satellite team at NASA’s Goddard Space Flight Center in Greenbelt, Maryland. With PACE data, scientists simplify complex light spectra into a single index known as apparent visible wavelength to measure phytoplankton abundance in near-real time [1].
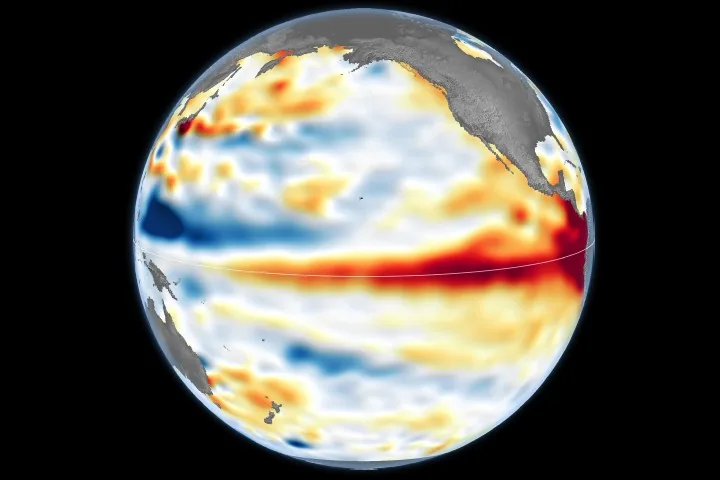
Comparing satellite maps from 2025, a weak La Niña year, with 2026 observations shows green equatorial sections shrinking while bluer shades fill in. Because phytoplankton form the base of the marine food web, their sharp drop forces fish and other marine life to relocate to new feeding grounds. By adding hyperspectral color tracking to traditional altimetry, NASA satellite observation captures both the physical movement of warm water and its ecological consequences. These measurements complement other orbital systems, including the PolCube mission measuring atmospheric and oceanic conditions, to clarify how biological systems respond to physical shifts in the ocean [1].


Global Precipitation Shifts Mapped by IMERG
To track how shifted ocean heat rearranges weather on land, NASA satellite observation relies on near real-time estimates of global rain and snowfall produced by the IMERG processing system. IMERG stands for Integrated Multi-satellitE Retrievals for the Global Precipitation Measurement (GPM) Mission. Every half hour, the data-processing algorithm calculates worldwide rain and snowfall totals across a grid of roughly 11 kilometers, or 0.1 degrees in latitude and longitude [3].
During the three-month period from July through September 2026, global rainfall deviated sharply from the long-term average calculated between 1998 and 2025. In absolute terms, the two largest precipitation anomalies occurred near the equator over the Pacific Ocean, where rainfall was 500 millimeters (20 inches) greater than average in the Central Pacific and 400 millimeters (16 inches) less than average in the Western Pacific. While frequent storms near the equator produce heavy annual rainfall, large seasonal shifts alter normal weather across continents. For example, parts of India suffered their worst summer drought since 2015, another year when a strong El Niño ramped up [3].
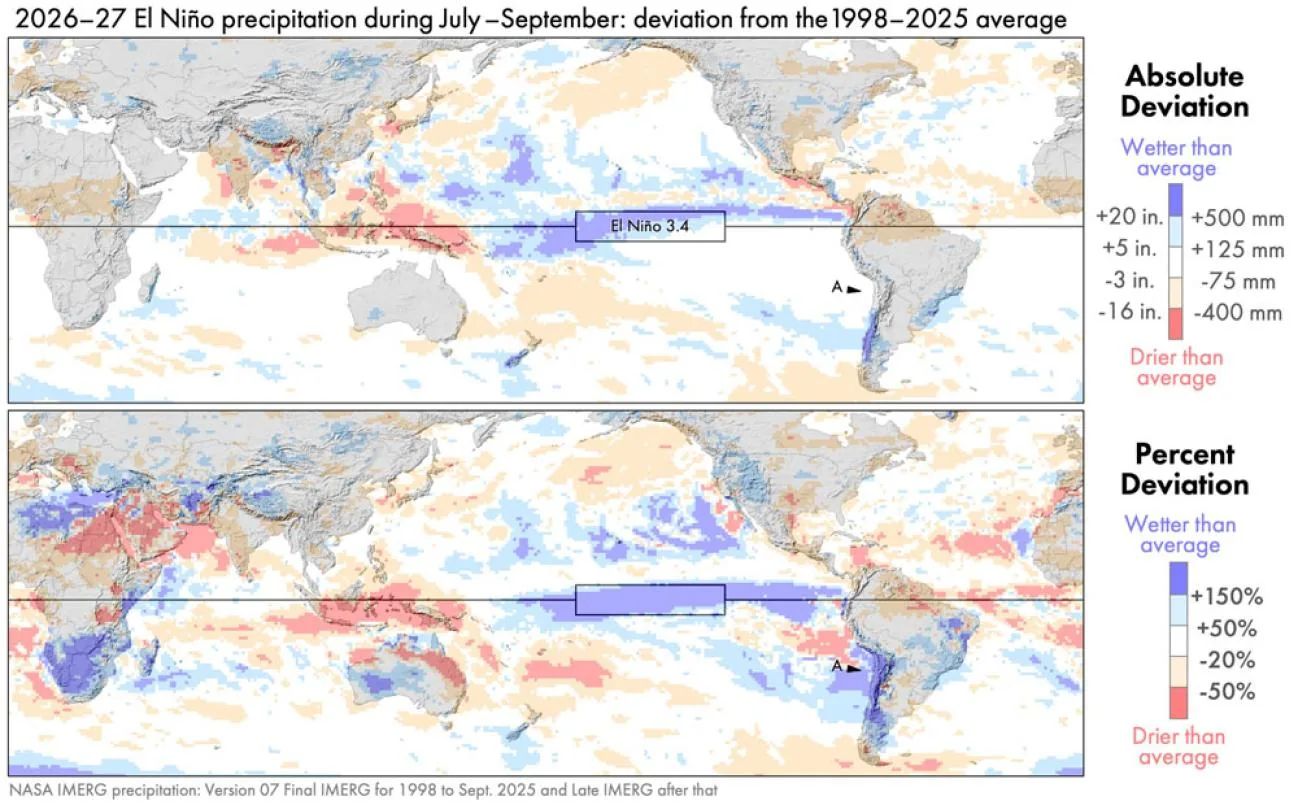
Satellite datasets require independent verification, especially over dry ground where rain can evaporate before hitting the surface. NASA scientists compared near real-time IMERG estimates with the GPCC First Guess gauge dataset compiled by the German meteorological service. Despite different measurement techniques—ground gauges collecting continuous localized data while satellites cover broad regions during overpasses—both datasets agreed on the sign and general location of major continental precipitation anomalies [3].
Why Did Pacific Warming Trigger Atacama Desert Rains?
Heavy rains hit hyper-arid areas because shifted Pacific wind patterns guided humid tropical air into regions that rarely see moisture. According to IMERG estimates, Chile’s Atacama Desert received rainfall during July to September 2026 that was 150% above average, meaning two and a half times normal seasonal precipitation fell on the desert [3].
A weather station in the desert (gauge #230001) receives an average of 4 mm (0.16 inches) of rain per year, but recorded 14.8 mm (0.58 inches) in August 2026 alone. Most of that rain fell on a single day, August 18, 2026, when an upper-level cutoff low pulled humid tropical air south toward northern Chile. Cutoff lows occur off western South America but this storm formed further north than usual, matching patterns analyzed by Fuenzalida, Sánchez, and Garreaud in their Southern Hemisphere climatology [7]. That same day, an atmospheric river brought humid tropical air to central Chile, following the conveyor-belt structure described by Dacre and Clark [8].

More atmospheric rivers reach the southwestern coast of South America during El Niño years, as documented in climate research by Gibson and colleagues [9]. To examine the storm, scientists used the GPM Microwave Imager (GMI) on the GPM Core Observatory satellite. Passive microwave radiometers see into clouds to measure precipitation. Researchers processed three GMI frequencies into false-color images using methods proposed by Negri et al. in 1987, mapping water vapor distribution across the storm [3].
How NASA Satellite Observation Informs Climate Forecasts
Daily orbital measurements track the expanding warm pool as the event progresses toward its expected winter peak. On the ElNinoLive map, which updates daily from NASA GHRSST data, sea surface temperature anomalies in the Niño 3.4 region (5°N–5°S, 170°W–120°W) reached +3.3°C during the week of October 7, 2026. NOAA’s relative Oceanic Niño Index (RONI) measured +1.7°C for July to September 2026 [4].
These numbers provide early information for farmers, firefighters, and coastal planners preparing for droughts and flooding. Closer to the South American coast, the Niño 1+2 region is also running warm anomalies, a key indicator watched closely by flood forecasters in Peru and Ecuador. Meanwhile, fresh Kelvin waves arriving from the west appear as warm blobs that drift eastward before merging into the central equatorial tongue. Comparing these thermal signatures with past events helps researchers distinguish short-term weather spikes from coupled ocean-atmosphere patterns [4].
NASA satellite observation continues to track this event with an expanding fleet of orbital instruments. In institutional reports from Cosmos Week and PressBee, researchers note that linking new observations to long-term records gives Earth science its interpretive strength [5, 6]. As Josh Willis concluded from JPL: “El Niño touches almost all of us in some way every time it occurs. While many have seen what it can do, we look to the ocean to understand why” [1].
- PRESS RELEASE McNamee, E., & Younger, S. (2026, October 15). NASA satellites observe historic 2026 El Niño. NASA Science. [Article Link]
- WEBSITE Dauphin, L., & Hansen, K. (2026, June 18). El Niño is underway. NASA Earth Observatory. [Article Link]
- REPORT Global Precipitation Measurement Mission. (2026, October 12). Global precipitation during July to September of the 2026-27 El Niño. NASA. [Article Link]
- WEBSITE Vladymyr, I. (2026, October 7). El Niño live map: Sea surface temperature anomalies. ElNinoLive. [Article Link]
- ONLINE NEWS Cosmos Week Editorial Desk. (2026, October 15). NASA satellites observe historic 2026 El Niño. Cosmos Week. [Article Link]
- ONLINE NEWS PressBee Editorial Team. (2026, October 15). NASA satellites observe historic 2026 El Niño. PressBee. [Article Link]
- ACADEMIC JOURNAL Fuenzalida, H. A., Sánchez, R., & Garreaud, R. D. (2005). A climatology of cutoff lows in the Southern Hemisphere. Journal of Geophysical Research: Atmospheres, 110(D18). [Article Link]
- ACADEMIC JOURNAL Dacre, H. F., & Clark, P. A. (2025). A kinematic analysis of extratropical cyclones, warm conveyor belts and atmospheric rivers. npj Climate and Atmospheric Science, 8(1). [Article Link]
- ACADEMIC JOURNAL Gibson, P. B., Rampal, N., Goddard, F. W., Guan, B., DeFlorio, M. J., & Prince, H. D. (2026). Emerging trends in landfalling atmospheric rivers over the South Pacific. npj Climate and Atmospheric Science, 9(1). [Article Link]
APA 7: TWs Editor. (2026, October 16). How NASA Satellite Observation Tracks the 2026 El Niño. PerEXP Teamworks. https://perexpteamworks.com/en/nasa-satellite-observation-tracks-2026-el-nino/


