





What does the latest biodiversity data show about the health of animals worldwide? The 2026 Living Planet Report, prepared by WWF and the Zoological Society of London, shows that monitored wildlife populations decline by an average of 73% between 1970 and 2022. That metric does not mean that 73% of individual animals have died or that three-quarters of species have gone extinct. Instead, it tracks the average rate of shrinkage among monitored vertebrate groups across decades. The global survey now records this 73% drop across 35,803 separate populations [4].
How Much Do Wildlife Populations Decline?
Monitored wildlife populations have dropped by an average of 73% between 1970 and 2022, according to the 2026 Living Planet Report compiled by the Zoological Society of London and WWF [7]. Many readers misread that headline number as proof that 73% of all wild animals have vanished from the planet. In reality, the index calculates the geometric mean (a mathematical average that prevents huge populations from drowning out small ones) of change rates across monitored groups relative to their baseline counts [6]. Under this mathematical rule, a group of 100 frogs that shrinks to 10 carries the exact same weight in the index as a flock of 10 million birds that drops to 1 million, since each experienced an equal 90% reduction.
Because each monitored group carries equal mathematical weight, a handful of groups that collapse can pull the entire average downward while many other groups stay steady. Hannah Ritchie of Our World in Data explained that the 2026 update added about 1,000 populations and 300 vertebrate species compared to the 2024 survey, bringing the total count to 35,803 populations across 5,790 species [5]. These additions shifted the whole historical trend line rather than revealing a steep fall between recent survey cycles. The shift shows that long-term tracking reflects gradual data growth rather than sudden changes over two years.
What Animal Populations Are Decreasing?
Freshwater species have suffered the steepest losses worldwide, falling by an average of 85% since 1970 [4]. Dams, water pollution, agricultural runoff, and river fragmentation place heavy stress on rivers, lakes, and wetlands, which hold a large share of vertebrate life relative to their land area. On land, terrestrial vertebrate populations dropped by an average of 69% over the same five decades [7]. Marine species fell by an average of 59%, showing that oceanic pressures have also thinned fish and sea creatures over time.
Regional numbers reveal stark geographic contrasts, with monitored populations in Latin America and the Caribbean recording an average fall of 95% since 1970 [6]. Deforestation in the Amazon and freshwater habitat loss drive much of that regional plunge. In Africa, monitored wildlife groups experienced an average fall of 80% during the same period [7]. Farming expansion is the main cause of habitat loss on land, as forests give way to croplands and pastures, while hunting and overfishing deplete animals in wild areas.
What Animal Populations Are Increasing?
Focused conservation work has helped several monitored groups grow, most clearly seen among wild tigers whose global numbers rose from roughly 3,200 in 2010 to around 5,700 by 2025 [7]. That gain of more than 70% proves that protecting forest reserves and curbing poaching can help large predators rebound. In the oceans, Atlantic and Pacific bluefin tuna recovered after regional fishery bodies set binding catch limits, allowing both stocks to move off threatened lists.
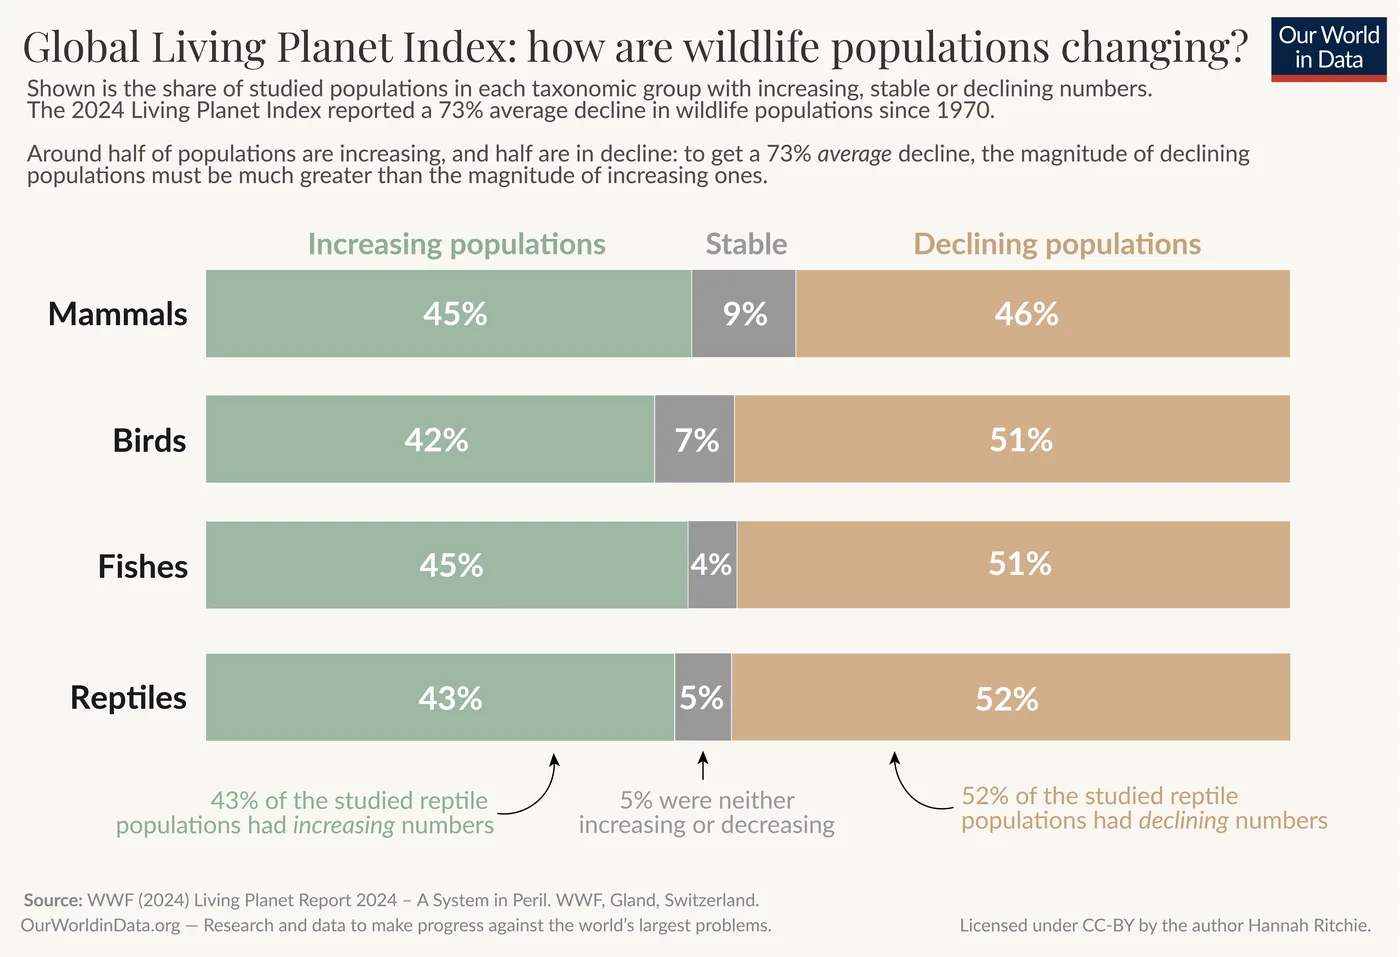
Data from Our World in Data show that across the full Living Planet database, exactly 50% of populations declined, while 43% increased and 7% stayed stable [5]. In Europe, legal protection and rewilding helped European bison, Eurasian beavers, and gray wolves return to river valleys and woodlands where they had vanished decades earlier [8]. In 2025, the green sea turtle moved from Endangered to Least Concern following fifty years of coordinated beach protection across more than 80 nesting countries [7].

In central Africa, field teams adapting gorilla conservation strategies balancing health risks have shielded vulnerable apes from disease outbreaks and habitat disruption. Community-led patrols show that when rangers work with local villages, rare primates can hold their ground even when outside threats multiply [7]. Protecting these animals takes steady funding and continuous effort on the ground.


Why Monitoring Wildlife Populations Leaves Gaps
Counting wild animals on the ground takes field labor, tracking gear, and expert staff that satellites cannot replace from space. A preprint study by Hannah Sarah Wauchope, Gary David Powney, and Nick Isaac—which has not yet undergone formal peer review—examined how these monitoring gaps influence global biodiversity numbers [1]. Many animal groups lack systematic monitoring programs, leaving scientists reliant on ad hoc academic surveys, patchy tracking projects, and local game management data. Historic records cannot be rebuilt after the fact, so researchers must work with sparse timelines that sometimes hold only two counts across five decades [4].
Because remote forests and wetlands rarely have full-time field researchers, vast areas of wilderness remain uncounted. When scientists look at raw, unweighted field counts in databases like BioTIME, the number of rising populations roughly matches the number of falling populations [4]. That balance puzzles observers. If counts come mainly from places where nature is doing well, global indicators must adjust their statistical models so that well-studied parks do not mask wildlife losses in unmonitored zones.
Understanding Shifts in Wildlife Population Trends
Preliminary work by Wauchope and colleagues shows that counts in the Living Planet Index tilt toward protected areas and national parks where habitats remain mostly intact [4]. If counts come mainly from protected land, scientists risk underestimating how fast wildlife populations decline in degraded areas. Yet sampling biases can also tilt in the other direction. Counts often track threatened species or heavily harvested animals such as commercial fish, which are groups that people already expect to be falling.
To spot and measure these sampling skews, ecologists use tools like ROBITT (a system for checking the risk of bias in temporal ecology trends) built by Boyd and colleagues [3]. Natural communities always show a mix of winners and losers, a pattern described by Maria Dornelas and co-authors in Ecology Letters [2]. Farmland birds, for example, may thrive when forests become fields, even as forest specialists disappear. To balance these geographic skews, the 2026 index boosted African counts by 14% for populations and 38% for species, adjusting older curves to better capture regions facing heavy habitat conversion [5].
Earlier adjustments also altered global calculations. In the 2024 report, authors Hannah Ritchie and Fiona Spooner explained that excluding non-native species caused European and Central Asian population numbers to shift downward [8]. In Africa, adding 45% more populations in that earlier edition similarly pushed regional trends lower. These technical changes remind readers that a single headline percentage reflects an evolving scientific model rather than a simple census of wild animals.
Reforming Food Systems to Protect Habitats
Stopping the loss of biodiversity requires changing how human societies produce food and spend money. Agriculture drives most habitat destruction on land, with wild forests cut down to grow crops like soybeans in South America to feed farm animals overseas [7]. A national security assessment in the United Kingdom warned that key ecosystems are on paths to collapse, threatening economic stability because half of global gross domestic product depends on natural systems. Tanya Steele, chief executive at WWF-UK, said that nature loss is already sending us the bill through rising risks to food supplies, water security, and economic stability.
Local stewardship provides practical paths forward, as seen in southern Africa where elephants stay stable or grow when local communities manage their own land rights. Similar conservation lessons emerge when tracking how African wild dogs dispersing thousands of kilometers across fragmented habitats need open migration paths, or examining how giant mammals declined due to human pressure rather than climate fluctuations in prehistoric epochs. Dr Louise McRae of ZSL said: “Behind every global statistic is evidence of wildlife populations rebounding and habitats recovering, driven by people working together to reverse biodiversity loss” [7].
Reversing nature loss will require positive tipping points across energy, food, and finance [7]. Deliberate policy shifts and public investments have already made solar and wind energy cheaper than fossil fuels. Steering farm subsidies toward nature-friendly practices and removing deforestation from retail supply chains can protect habitats before monitored wildlife populations decline past points of no return.
- PREPRINT Wauchope, H., Powney, G., & Isaac, N. (2026). Wildlife populations have declined 73% since 1970 – but many of the world’s animals still aren’t being counted [Preprint]. [Article Link]
- ACADEMIC JOURNAL Dornelas, M., Gotelli, N. J., Shimadzu, H., Moyes, F., Magurran, A. E., & McGill, B. J. (2019). A balance of winners and losers in the Anthropocene. Ecology Letters, 22(5), 847-854. [Article Link]
- ACADEMIC JOURNAL Boyd, R. J., Powney, G. D., Burns, F., Danet, A., Duchenne, F., Grainger, M. J., Jarvis, S. G., Martin, G., Nilsen, E. B., Porcher, E., Stewart, G. B., Wilson, O. J., & Pescott, O. L. (2022). ROBITT : A tool for assessing the risk‐of‐bias in studies of temporal trends in ecology. Methods in Ecology and Evolution, 13(7), 1497-1507. [Article Link]
- ONLINE NEWS Powney, G. D., Wauchope, H. S., & Isaac, N. (2026). Wildlife populations have declined 73% since 1970 – but many of the world’s animals still aren’t being counted. The Conversation. [Article Link]
- WEBSITE Ritchie, H. (2026). A 73% average decline in wildlife populations: An overview of the 2026 Living Planet Index report. Our World in Data. [Article Link]
- WEBSITE Khan, K. (2026). The 73% wildlife decline figure, explained. World Animal Rescue Network. [Article Link]
- ONLINE NEWS Sinha, N. (2026). Monitored wildlife populations see average 73% decline since 1970, WWF report finds. Times Now. [Article Link]
- WEBSITE Ritchie, H., & Spooner, F. (2024). The 2024 Living Planet Index reports a 73% average decline in wildlife populations — what’s changed since the last report? Our World in Data. [Article Link]
APA 7: TWs Editor. (2026). Why Wildlife Populations Decline by 73% in Monitored Global Data. PerEXP Teamworks.


